// 2026-06-25 · Maps & Exploration · by Bob Smith
Blitzortung: Watch Lightning Strike the Planet Live
The Blitzortung Lightning Map shows strikes worldwide seconds after they happen, built by a volunteer detector network. Turn the sound on. Free and hypnotic.
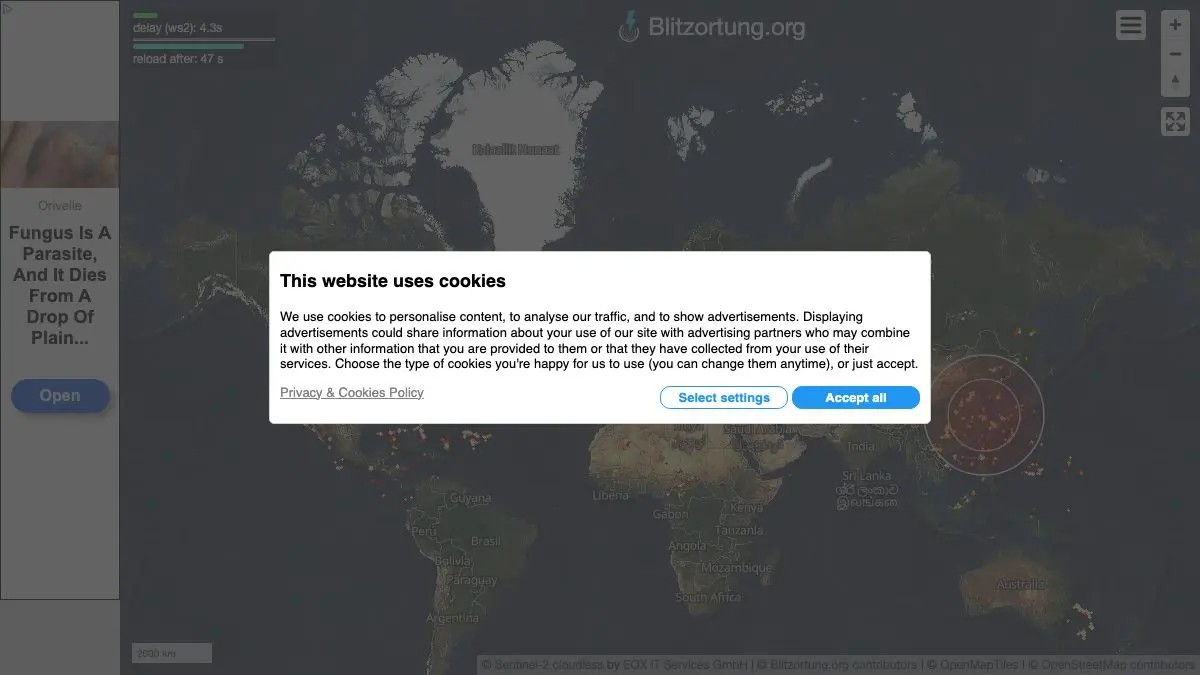
The Blitzortung Lightning Map shows lightning striking the planet, live, seconds after it happens. Each strike blooms on the map as a circle, colored by how recently it hit, and you can turn on sound so the storms tick and click as they roll across a continent. It is free, it is built by volunteers with homemade radio receivers, and it is one of the most quietly astonishing things on the internet.
What is Blitzortung?
Lightning is loud on the radio. Every strike dumps a burst of very low frequency energy that travels enormous distances through the atmosphere, which means you can hear a storm from thousands of miles away if you know how to listen.
Blitzortung is a global network of people who listen. Volunteers run detection stations, each one timestamping incoming pulses with extreme precision. When several stations detect the same pulse, the tiny differences in arrival time let the system triangulate where the strike happened, and the result appears on a public map almost immediately.
There is no satellite here, no government agency, no subscription. It is a distributed instrument built out of enthusiasm, and it covers a remarkable amount of the planet.
Watching it is genuinely mesmerizing. Strikes appear as circles that fade over time, with the color indicating age, the newest are bright, and they darken as the minutes pass. Storms do not look like blobs on this map. They look like swarms. You can see a squall line advancing as a moving front of flashes, and thunderstorm cells firing dozens of times a minute like something breathing.
What can you do on the map?
- Watch strikes appear in near real time. The whole appeal in one line. Open it during a storm and you will not look away.
- Turn the sound on. Each detected strike gets a click. A busy storm becomes a rainstorm of ticks, and it is unreasonably satisfying.
- Switch regions. The map is served in regional views, so you can zoom in on the continent where the weather is actually happening.
- Read the colors. Colors run from newest to oldest across a rolling time window, so you can see instantly which cells are active now and which have moved on.
- Change the map style. Satellite and relief styles are available, plus day and night shading, which makes the geography of a storm much easier to read.
- Adjust the animation. Animation speed and timing settings let you slow things down or speed them up.
- Look at the detector network. You can see the stations themselves and their coverage, which is a nice reminder that this is people, not infrastructure.
Tips to get the most out of it
Turn on the sound, then leave the tab open. This is the tip. Put it on a second screen during a storm and let it tick away in the background. You will start noticing cells firing before you hear the thunder outside.
Switch to the relief or satellite map style. The default is fine, but terrain context transforms the experience, you can watch storms track along mountain ranges and pile up on coastlines.
Check the coverage map before you draw conclusions. Detection quality depends on how many volunteer stations are nearby. A quiet-looking region might be quiet, or it might just be thinly covered.
Follow the day. Convective storms fire in the afternoon heat, so the map has a rhythm that follows the sun around the globe. Watch the tropics in their local afternoon and it gets busy fast.
Never use it for safety. The site says this itself and it is worth repeating: this is entertainment, not a warning system. Positions can be off. Use your national weather service for anything that matters.
Compare it against a proper weather map. Line Blitzortung up next to a radar or wind map and the whole picture snaps into focus, you can see the front, then watch it announce itself in flashes.
If you like Blitzortung, also try…
- Windy: the most beautiful weather map on the internet, with animated wind, rain and storm layers you can stack.
- earth :: nullschool: a spinning globe of global wind and ocean currents rendered as flowing lines, and endlessly hypnotic.
- Flightradar24: watch aircraft in the sky live, and notice how they bend around exactly the storms Blitzortung is lighting up.
- wttr.in: the fastest forecast on the web, delivered as plain text in your terminal or browser.
More live maps in our Maps & Exploration collection. Then open Blitzortung, turn the volume up, and listen to the sky.
Frequently asked questions
What is the Blitzortung Lightning Map?
Blitzortung is a real-time world map of lightning strikes, fed by a network of volunteer-operated detection stations. When enough stations pick up the radio pulse from a strike, the system triangulates its position and plots it on the map within seconds. The site is free and community-run rather than a commercial weather service.
Is Blitzortung free?
Yes. Viewing the map costs nothing, requires no account, and the map can even be embedded on other websites. The whole project is volunteer-driven, with participants running detection hardware and contributing their data to the network.
How does Blitzortung detect lightning?
Lightning emits a burst of very low frequency radio energy that travels a long way. Volunteers run receivers that timestamp these pulses with high precision, and by comparing arrival times across multiple stations the network calculates where the strike occurred. More stations in a region means better coverage and more accurate positions.
Can I rely on Blitzortung for safety?
No. The site states plainly that it is for entertainment purposes and that its data should not be used to protect people or equipment, and it acknowledges that strike positions can be inaccurate. For safety decisions, use official weather warnings from your national meteorological service.
Visit Blitzortung Lightning Map →
← All posts · Browse the directory