// 2026-08-10 · Tools & Utilities · by Bob Smith
Desmos: The Free Graphing Calculator That Makes Maths Something You Can Watch
Desmos plots any equation the instant you type it, turns constants into draggable sliders, and fits curves to your data — free, in a browser, with no account required.
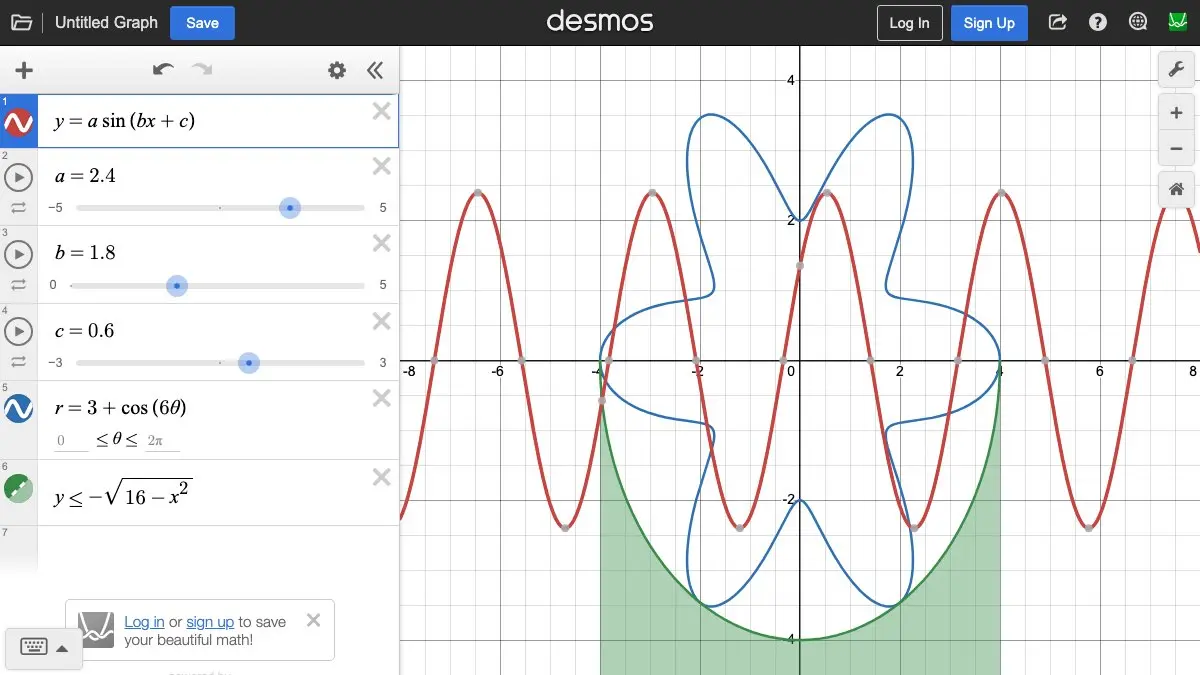
Desmos is what happens when someone decides a graphing calculator should be pleasant. You type an equation into the list on the left, and the curve is already drawn before you finish the line. There is no plot button, no wizard, no dialog asking for a domain and a range. Type, see, adjust.
The thing that makes it more than a fast plotter is the slider. Write y = ax^2 + bx + c and Desmos notices it does not know what a, b and c are, and offers to make each one a slider. Drag them and the parabola moves in real time. Fifteen seconds of dragging teaches more about what the coefficients do than a page of worked examples.
What is Desmos?
Desmos is a free browser-based graphing calculator built by Desmos Studio, a public benefit corporation whose stated job is to keep these tools free. The classroom-activities side of the old Desmos company was sold to Amplify in 2022; the calculators stayed behind with Desmos Studio and remain free to everyone, with no account, no ads and no upsell.
It is quietly one of the most-used pieces of maths software in the world. The graphing calculator sits alongside a scientific calculator, a four-function calculator, a matrix calculator, a geometry tool and a 3D calculator, and a version of it is embedded directly in the digital SAT, which means a large fraction of American teenagers now do their exam maths in this exact interface.
The technical part worth knowing is the notation. Desmos renders proper mathematical typesetting as you type — fractions stack, exponents rise, square roots grow to fit their contents. You are not translating your maths into a one-line programming syntax and hoping you bracketed it correctly. It looks like the thing you meant.
What can you do with Desmos?
- Graph anything as you type it, including explicit functions, implicit relations like
x^2 + y^2 = 9, inequalities that shade the region they describe, parametric curves and polar equations. - Turn constants into sliders with one click, then animate them so a parameter sweeps back and forth while the curve responds.
- Restrict a graph to a domain with curly braces —
y = x^2 {0 < x < 3}— which is how you build piecewise shapes and, eventually, drawings. - Fit models to data. Drop numbers into a table, write your model with a
~, and get the parameters, R², and residuals back with the curve plotted. - Work with lists as first-class objects, so you can generate points, transform them, and plot whole families of curves in a single expression.
- Read off the interesting points. Click any curve for coordinates; intersections, roots, maxima and minima are marked automatically without you asking.
- Hear a graph instead of seeing it. Audio trace plays a curve as a rising and falling tone, with clicks at intersections, which makes the calculator genuinely usable by blind students — a rarity in this category.
- Share and embed. Every graph has a link that opens editable for whoever you send it to, plus image export and iframe embedding.
Tips to get the most out of it
- Learn the subscript trick for tables. Columns in a table are
x_1andy_1, and those names are usable anywhere else in the expression list. That single fact is what unlocks regressions, so learn it before you need it. - Use
~rather than=when you want a fit. The tilde tells Desmos “solve for the unknown parameters so this is as close to true as possible.” It works with any model you can write, not just the fits in a spreadsheet menu. - Click the play button on a slider. Static sliders are useful; animated ones are the demonstration. Set the range and step first, or the animation runs too fast to read.
- Fold long work into folders and notes. The expression list supports folders and plain text notes, which turns a messy 40-line graph into something you can hand to another person.
- Try the 3D calculator for surfaces. Two-variable functions like
z = sin(x)cos(y)belong at desmos.com/3d, which rotates and shades them properly rather than faking depth. - Save before you share anything you care about. An unsaved share link is a snapshot of the current state. A saved graph gets a title and a stable home in your list.
- Install the mobile app if you rely on it. The apps work without a connection, which matters more than it sounds when the thing you need to check is a function and the thing you have is a train tunnel.
If you like Desmos, also try…
- Wolfram Alpha: when you want the answer and the working rather than the picture.
- Omni Calculator: thousands of ready-made calculators for the problems you cannot be bothered to model yourself.
- BetterExplained: the intuition behind the maths Desmos draws, written by someone who remembers being confused.
- Algebra Rules: a clean single-page reference for the identities you keep half-remembering mid-graph.
Browse more things worth bookmarking in our Tools & Utilities collection.
Frequently asked questions
What is the Desmos Graphing Calculator?
Desmos is a free online graphing calculator that plots equations as you type them. You write something like y = sin(x) in the expression list on the left and the curve appears on the right immediately, with no plot button to press. It handles functions, inequalities, parametric and polar equations, data tables, statistical regressions, lists and piecewise definitions, and it renders proper mathematical notation as you type rather than making you write everything on one line. It runs in any modern browser and there are free mobile apps for iOS and Android.
Is Desmos free, and do I need an account?
The calculator is free and you do not need an account to use any part of it. Open the page and start graphing. A free account only adds the ability to save named graphs to your own list and organise them into folders; it is not a paywall on features. Desmos Studio is a public benefit corporation whose stated purpose is keeping these tools free, and the calculators are used by tens of millions of people a year, including inside the digital SAT, where a Desmos calculator is built into the test software.
Can Desmos do regressions and fit a curve to data?
Yes, and this is one of its best-kept features. Put your data into a table, then write a model with a tilde instead of an equals sign — for example y1 ~ mx1 + b for a linear fit, or y1 ~ a * e^(k * x1) for exponential growth. Desmos solves for the parameters, displays them along with R squared and the residuals, and plots the fitted curve over your points. Because you write the model yourself, you are not limited to the handful of fit types a spreadsheet offers.
How do I share a Desmos graph with someone?
Every graph gets a share link from the share button in the top right, and anyone who opens it sees your expressions and can edit their own copy without signing in. There are also options to export an image, and to embed the interactive calculator in a page via an iframe. Saving a graph under your account first gives it a stable link and a title; sharing an unsaved graph creates a snapshot link of its current state.
Visit Desmos Graphing Calculator →
← All posts · Browse the directory