// 2026-08-05 · Data & Research · by Bob Smith
Connected Papers: See the Shape of a Research Field in One Graph
Connected Papers turns a single academic paper into a visual map of the work around it, so you can see a field's structure instead of chasing citations one by one.
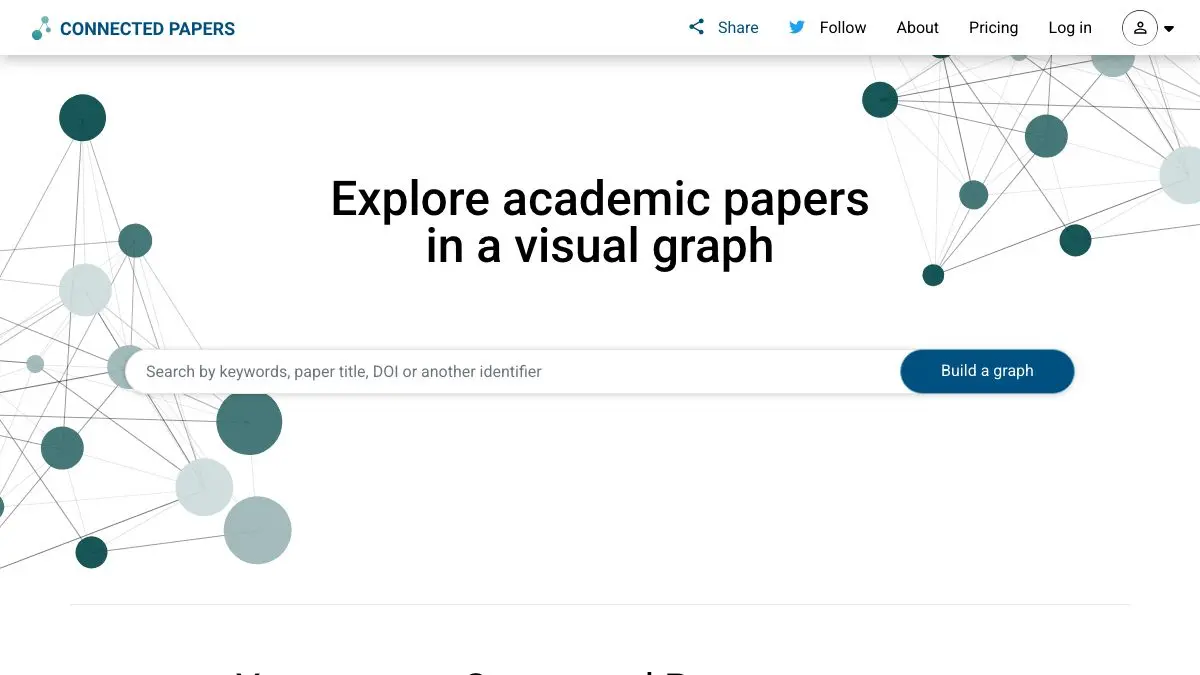
Connected Papers answers a question every literature review starts with and no database answers well: what else is out there like this? You paste in one paper. It draws you a map. Forty-odd related works arranged so that the closely related ones cluster together, sized by how often they have been cited, colored by year. In about fifteen seconds you can see something that used to take a week of chasing footnotes: the shape of a field.
What is Connected Papers?
The traditional way to explore a research area is to pick a paper, read its reference list, read those papers’ reference lists, and repeat until you either understand the field or lose your mind. It works, slowly, and it has a serious blind spot: citation trails only find papers that someone chose to cite. Two teams solving the same problem in parallel, six months apart, citing neither each other nor a common ancestor, will never appear in each other’s trails.
Connected Papers gets around this by not using direct citations as its similarity measure. It uses co-citation and bibliographic coupling instead. Two papers score as similar if they draw on the same sources, or if later work tends to cite both together. This is a much better proxy for “these are about the same thing,” and it routinely surfaces relevant work that a reference-chasing session would miss entirely.
The output is a force-directed graph. Similar papers get pulled together, dissimilar ones drift apart, and clusters emerge that usually correspond to real sub-topics within the field. Node size is citation count, node color is publication year, so at a glance you can tell whether a cluster is foundational old work or an active recent front. Underneath it runs on the Semantic Scholar corpus, which means coverage is broad across the sciences and increasingly decent in the humanities.
The two supplementary views are where it gets genuinely useful. Prior Works lists the papers most commonly cited by everything in your graph, which is a reliable way to find the field’s foundational texts. Derivative Works lists the papers that most often cite your graph’s contents, which is how you find the recent survey or the review article that already did your synthesis for you.
What can you do with Connected Papers?
- Build a graph from any paper. Search by title, DOI, arXiv ID, or paste a URL. You get a map of roughly the forty most similar papers, no account required for the first few.
- Spot the foundational work. The Prior Works tab surfaces the most-cited ancestors of everything in your graph. These are the papers you actually need to read first.
- Find the survey you should have started with. Derivative Works lists what cites your cluster most, which is where review articles and follow-up syntheses show up.
- Read the clusters. Distinct blobs in the graph usually mean distinct sub-approaches. Clicking through one cluster at a time is a fast way to learn how a field divides itself.
- Expand a graph. Add nodes to grow the map outward when the initial forty papers are not enough.
- Build a shared collection. Graphs can be grouped and shared, which is handy for a reading group or a supervisor who wants to see what you have covered.
- Jump straight to the paper. Every node links out to the abstract and, where available, the full text or a preprint.
Tips to get the most out of it
Pick your seed paper carefully. The entire graph is generated from one input, so a badly chosen seed gives you a badly shaped map. Use a well-cited, on-topic paper rather than the most recent thing you happened to read.
Run it from two or three different seeds. Papers that appear in every graph are the ones the field genuinely revolves around. Papers that appear in only one are either niche or noise, and comparing the graphs tells you which.
Read Prior Works before anything in the graph itself. It is the closest thing to an automatically generated “start here” list, and working backward to the foundations first makes everything else easier to place.
Use the year coloring to date the field. A graph that is all dark, older nodes means the area has gone quiet. A bright, recent cluster off to one side usually means something new happened there, and that is worth investigating.
Do not treat it as a search engine. It finds papers similar to one you already have. It will not find you a topic from scratch. Start with a keyword search elsewhere, then bring the best result here.
Remember what it cannot see. Very new preprints, book chapters, and work in fields with poor metadata coverage are under-represented. An empty-looking graph sometimes means thin indexing rather than a thin literature.
If you like Connected Papers, also try…
- Semantic Scholar: the corpus that powers these graphs, with AI summaries and citation context on every paper.
- WorldCat: when the thing you need is a book in a library rather than a paper in a database.
- Our World in Data: rigorous, well-sourced research presented for people who are not going to read the paper.
- Wolfram Alpha: the other tool that answers questions databases are bad at answering.
More tools for finding out what is actually true in Data & Research, and the study-adjacent picks live in Learning & Education.
Frequently asked questions
What is Connected Papers?
Connected Papers is a visual tool for exploring academic literature. You give it one paper and it builds a graph of the papers most similar to it, positioning strongly related work close together and sizing nodes by citation count. It is designed to help you understand the structure of a research area rather than just follow a citation trail.
Is Connected Papers free?
There is a free tier that allows a limited number of graphs per month without an account, which is enough for casual use. Heavier users and institutions can pay for expanded access. The exact limits have changed over time, so check the site for current terms.
How does Connected Papers decide which papers are related?
It does not use direct citations as the primary signal. Instead it measures co-citation and bibliographic coupling: two papers are considered similar if they cite the same works, or if the same later works cite both of them. This surfaces papers that are topically close even when neither cites the other.
Where does Connected Papers get its data?
It draws on the Semantic Scholar corpus, which covers a very large share of published academic literature across disciplines. Coverage is strongest in fields with good open metadata, and thinner in areas where publishing happens mostly in books or non-indexed venues.