// 2026-05-11 · Data & Research · by Bob Smith
Our World in Data: Free Charts on How Life Is Changing
Our World in Data turns global research on health, energy, climate and poverty into free, sourced, downloadable charts, plus writing that explains them.
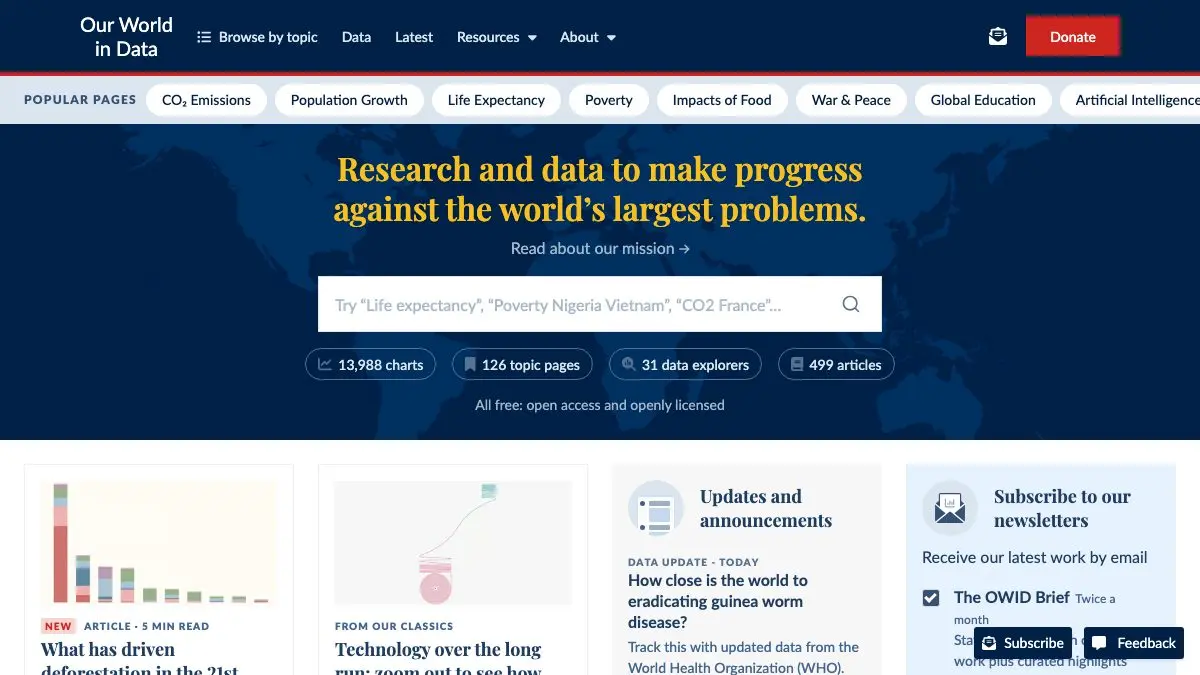
Our World in Data is a free research publication that answers big questions about the world with actual numbers. Child mortality, energy use, literacy, war deaths, CO2, vaccination rates, it charts them across centuries and countries, cites every source, and then explains what you are looking at in plain English.
It is the site to open when someone says “everything is getting worse” and you want to find out whether that is true.
What is Our World in Data?
It started as a researcher’s obsession with putting long-run data in one place and grew into a full publication run out of Oxford. The premise is simple and a little radical: the research on humanity’s biggest problems already exists, but it is locked in PDFs, spreadsheets and paywalled journals where nobody can use it. So they clean it, chart it, source it, and give it away.
Every chart on the site is interactive. You can add countries, switch to a map view, drag a time slider back a hundred years, toggle between absolute numbers and per-capita rates. Under each one is a list of exactly where the data came from. Under that, usually, is an article by a researcher explaining the caveats, because the caveats are the interesting part.
The tone is the thing that makes Our World in Data special. It is neither doom nor cheerleading. It will show you that global child mortality has fallen off a cliff in fifty years and, on the same page, that millions of children still die of preventable causes. Both facts, same chart.
What can you do on Our World in Data?
- Explore by topic. Dozens of topic pages: energy, pandemics, hunger, air pollution, democracy, plastic waste, each with a written overview and a wall of charts.
- Compare any countries you like. Add your country and four others to any chart and watch the lines diverge. It takes about three seconds and it is dangerously addictive.
- Scrub through time. Most charts have a slider. Watch a world map recolor itself decade by decade as electricity, vaccines or literacy spread.
- Download everything. CSV of the data, PNG of the chart, permanent link to the exact view you built. No signup wall.
- Read the explainers. Long-form articles on questions like how many people have ever lived, or why energy statistics are so hard to compare, written by people who clearly enjoy the footnotes.
- Grab the data explorers. Larger interactive tools let you pivot across metrics and sources in one interface, which is where the serious rabbit holes start.
Tips to get the most out of it
Always click “Sources” under a chart. It is the most underrated button on the site. You find out which agency collected the number, how, and where the definition changes between countries. This is how you stop being fooled by a confident-looking line.
Switch to relative view. Most charts toggle between totals and per-capita or percentage views, and the story often flips completely. Total emissions and emissions per person tell two very different tales about the same country.
Use the log scale. For anything that grew exponentially, GDP, cases, energy, the linear view is a hockey stick that hides all the detail. One click on log and a hundred years of history become readable.
Bookmark your customized chart. The URL updates as you add countries and change settings, so the link you copy reproduces exactly what you built. Perfect for winning arguments later.
Read the caveats before you quote the number. The articles frequently explain that a dataset undercounts, or changed methodology in 1990, or excludes a region. That paragraph is worth more than the chart.
If you like Our World in Data, also try…
- The Pudding: visual essays that answer strange cultural questions with rigorous data and gorgeous scrollytelling.
- Information Is Beautiful: data visualization as design object, where the chart itself is the point.
- Worldometers: live global counters ticking up in real time. Less rigorous, much more hypnotic.
- Wolfram Alpha: ask a factual question in plain language and get a computed answer instead of a page of links.
Dig through the rest of our Data & Research picks when you want facts with receipts.
Frequently asked questions
What is Our World in Data?
Our World in Data is a free research and data publication covering global problems like poverty, disease, energy, climate change and inequality. It combines interactive charts built from official datasets with written explanations of what the numbers actually mean. It is produced by researchers at the Global Change Data Lab together with the University of Oxford.
Is Our World in Data free?
Yes, entirely. There is no paywall, no subscription and no account needed. Most of the site's charts and data are published under an open license, so you can download, reuse and republish them with attribution.
Can I download the data behind the charts?
Yes. Every interactive chart has a Download option that gives you the underlying data as a CSV file, plus the chart itself as an image or a link. Each chart also lists its original sources, so you can trace a number back to the agency that published it.
Can I embed Our World in Data charts on my own site?
Yes. Each chart offers an embed code that drops the live, interactive version into your own page, and it keeps updating as the underlying data does. Attribution is expected, but no permission request or payment is required.