// 2026-07-26 · Data & Research · by Bob Smith
Information Is Beautiful: Data You Actually Want to Look At
Information Is Beautiful turns messy data into infographics you want to hang on a wall. Free, browsable by topic, and the source data is published too.
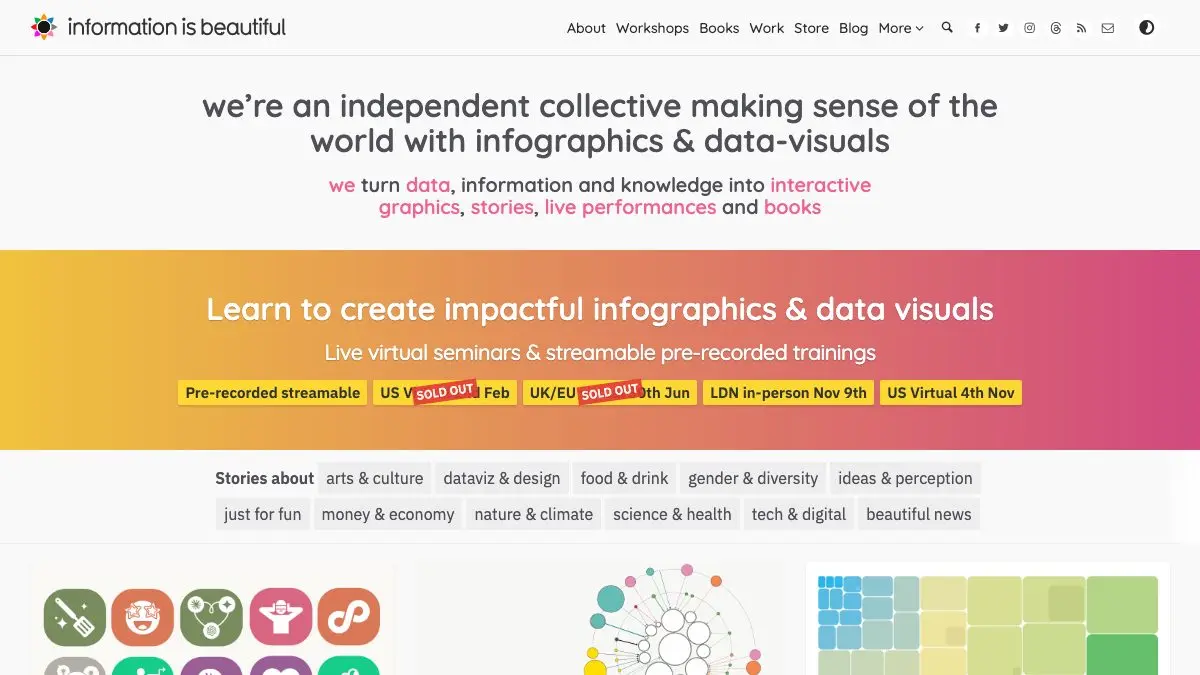
Information Is Beautiful is a gallery of data visualizations so well designed you forget you’re reading statistics. It’s the home of David McCandless and a small independent collective who take tangled datasets, global spending, drug effectiveness, common misconceptions, the plots of every movie you’ve ever seen, and turn them into a single picture that just makes sense. Free to browse, organized by topic, and quietly addictive.
What is Information Is Beautiful?
The pitch on the site is refreshingly plain: an independent collective making sense of the world with infographics and data-visuals. That’s exactly what it is. No feed, no hot takes, no infinite scroll of outrage. Just a shelf of carefully made images, each one the end result of somebody deciding a question deserved a proper answer and a proper layout.
What separates it from the endless supply of ugly charts on the internet is craft. The color choices are deliberate. The scales are honest. Labels sit where your eye actually goes. Some of these graphics have been circulating for over a decade, and they still hold up, because a good visualization doesn’t age the way a headline does.
And it’s not just eye candy. The collective publishes the underlying data for a lot of its work, which means you can go check the homework. That combination, genuinely beautiful and genuinely sourced, is rarer than it should be.
What can you do on Information Is Beautiful?
- Browse by topic. Stories are filed under headings like Science & Health, Money & Economy, Nature & Climate, Tech & Digital, Arts & Culture, Gender & Diversity, and the excellent catch-all Just For Fun.
- Dig into the data. The site’s data section links out to the spreadsheets behind many graphics, so you can verify a claim or reuse the numbers.
- Read Beautiful News. A stream of graphics about things that are quietly getting better: a genuinely useful antidote to a bad news day.
- Flip the lights off. There’s a dark theme toggle, which matters more than you’d think when you’re staring at saturated charts for an hour.
- Go deeper offline. The collective publishes books and prints, and runs data-visualization workshops if you want to learn to make this stuff rather than just admire it.
Tips to get the most out of it
- Start with “Just For Fun.” It’s the fastest way to understand the house style, and the pieces there are the most shareable. Then work outward into the heavier topics once you’re hooked.
- Click into the full-size version. Many of these graphics are dense. The thumbnail is a trailer; the full image is the movie. Zoom in and read the small print, the jokes are usually hidden there.
- Check the date on older classics. Some famous graphics are years old and the site is upfront about it. Great as design references, but if you’re quoting a number, follow it to the source data first.
- Steal the technique, not the picture. If you make charts at work, treat this site as a pattern library. Notice how rarely they use a pie chart, and how often a simple sorted bar does the job better.
- Use it as a conversation starter. Print one. Seriously. A well-made infographic on a wall gets more discussion than any dashboard ever has.
If you like Information Is Beautiful, also try…
- The Pudding: visual essays that answer oddly specific questions, with the interactivity turned all the way up.
- Our World in Data: the same respect for sources, applied to the biggest long-run questions about the planet.
- Coolors: because once you start caring about how a chart looks, you’ll want a palette generator open in the next tab.
More where that came from on the Data & Research page. Or just go straight to Information Is Beautiful and scroll until you learn something you didn’t mean to.
Frequently asked questions
What is Information Is Beautiful?
Information Is Beautiful is a gallery of data visualizations and infographics made by an independent collective led by David McCandless. The site turns statistics, research, and messy datasets into visuals designed to be understood at a glance. Everything is organized by topic, from science and health to money, nature, and pop culture.
Is Information Is Beautiful free?
Yes, browsing the visualizations on the site is free and no account is needed. The team earns money elsewhere, through books, prints, workshops, and commissioned work, so the online gallery stays open to everyone.
Can I see the data behind the graphics?
Often, yes. The site keeps a data section where the spreadsheets behind many visualizations are published, so you can check the sources, look at the raw numbers, and rebuild the chart yourself. That transparency is a big part of why the site is trusted.
Who is David McCandless?
David McCandless is the data journalist and information designer behind Information Is Beautiful, best known for books that popularized the modern infographic. He works with a small collective of designers and researchers who produce the site's visuals, live talks, and workshops.
Visit Information Is Beautiful →
← All posts · Browse the directory