// 2026-08-05 · Maps & Exploration · by Bob Smith
Ventusky: The Weather Map That Actually Looks Like Weather
Ventusky animates global wind, rain, temperature and pressure across a smooth timeline, with multiple forecast models and a clarity most weather maps never manage.
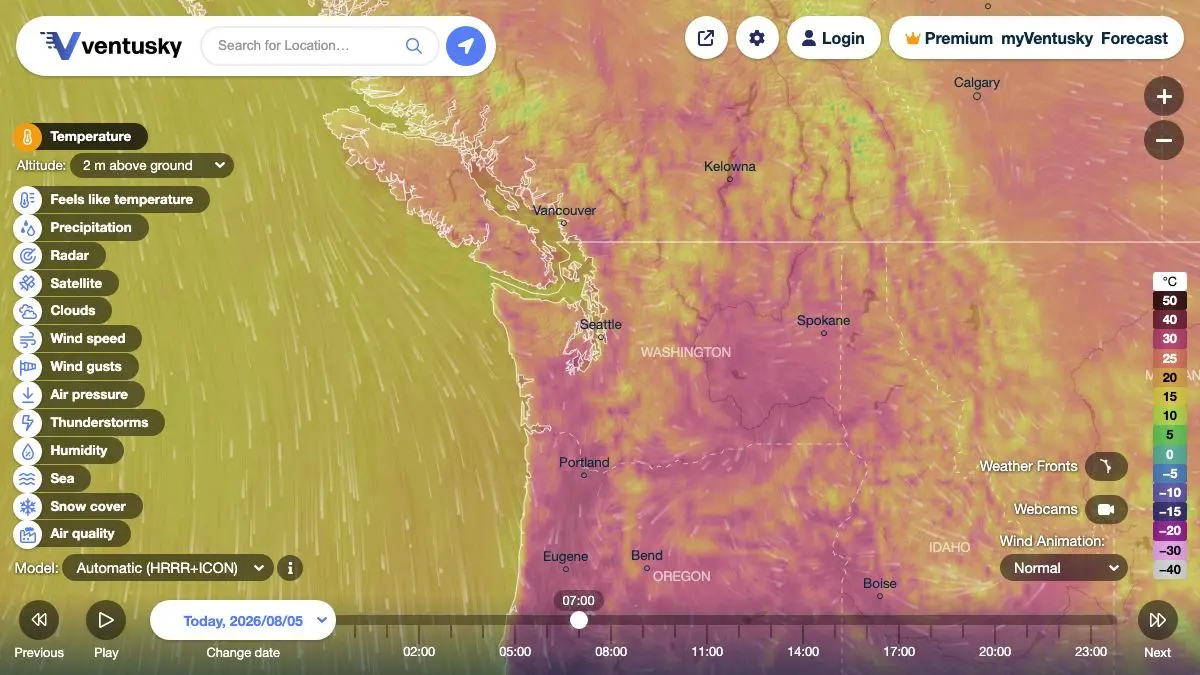
Ventusky is a weather map that treats the atmosphere as something worth looking at. Wind is drawn as a moving field of streaks that visibly curls around a low-pressure system. Rain arrives as soft, saturated bands sweeping across the terrain. Drag the timeline and the next four or five days play out as one continuous animation, which is a completely different experience from reading seven little cloud icons in a row.
What is Ventusky?
It comes from InMeteo, a small Czech outfit based in Pilsen, and it launched in the mid-2010s into a market that already had weather maps. What it did differently was take the rendering seriously.
Most weather sites present forecast data as a static image regenerated every few hours, or as a table of numbers. Ventusky treats the same data as a continuous field and interpolates through it, in space and in time, so panning and scrubbing feel like moving through the atmosphere rather than flipping between slides. Zoom in and the resolution improves. Drag the time slider and the systems move.
Underneath it is the standard machinery: output from numerical weather prediction models, global ones for worldwide coverage and higher-resolution regional models where they exist. Ventusky lets you switch between them, which is the feature that separates casual users from people who have been burned by a forecast. Two models agreeing is a forecast. Two models disagreeing is a warning that nobody actually knows.
The layer list goes well past what most people need, in a good way. Temperature, wind, gusts, precipitation, pressure, cloud cover, humidity, snow, wave height, air quality, and more besides. Each has its own color treatment, and they are, unusually for this genre, actually readable. Somebody thought about the palettes.
It runs fine on a phone, there are apps if you prefer, and the free web version does not hide the useful parts behind a wall.
What can you do with Ventusky?
- Watch the wind move. The default wind animation is the reason most people arrive, and it remains the best thing on the site.
- Scrub the timeline. Drag forward through the forecast period and watch fronts, storms and heat build and dissipate as one motion.
- Switch layers. Jump between rain, temperature, pressure, gusts, cloud and wave height without losing your place on the map.
- Change forecast models. Compare a global model against a regional one for the same location and time, and see how much they agree.
- Click a point for details. Tap anywhere and get a conventional forecast readout for that exact spot, with hourly figures.
- Check pressure and fronts. Isobars and pressure fields are rendered properly, which makes the shape of a weather system legible rather than implied.
- Look at the marine layers. Wave height and swell are there, which matters if you sail, surf, or just enjoy watching the North Atlantic behave badly in February.
- Use it on a phone. The mobile version keeps the animation intact rather than degrading to a static image.
Tips to get the most out of it
Compare two models before you trust a forecast. This is the single most valuable habit the site enables. If the global and regional models both show rain on Saturday, plan accordingly. If they disagree, the honest answer is that Saturday is unknown.
Learn the pressure layer. Wind and rain are the fun layers, but pressure is the one that explains them. Once you can see a low and read the rotation around it, the other layers stop being weather art and start being causal.
Watch gusts, not just wind speed. Average wind is a summary. Gusts are what removes your garden furniture, and the two layers can look surprisingly different.
Scrub slowly through a storm. Rather than jumping to a single hour, drag the timeline through the whole event. Seeing a system’s approach and departure gives you a much better sense of timing than any single frame.
Zoom in for the regional models. The extra resolution only shows up when you are close in and inside the coverage area of a high-resolution model. At global zoom you are looking at coarse data no matter which model you pick.
Remember what a forecast is. Beyond a few days, all of this is a smoothly animated statement of decreasing confidence. The prettiness of the rendering is not evidence.
If you like Ventusky, also try…
- Windy: the denser, more maximalist take on the same idea, with a deeper pile of specialist layers.
- earth :: nullschool: global wind and ocean currents on a rotating globe, and the visual ancestor of this whole genre.
- Blitzortung Lightning Map: real-time lightning strikes detected by a volunteer sensor network.
- wttr.in: the exact opposite approach, the forecast as plain text in a terminal.
More atmospheric time-wasting in Maps & Exploration.
Frequently asked questions
What is Ventusky?
Ventusky is an interactive world weather map that animates forecast data as flowing, colored layers. You can switch between wind, gusts, temperature, precipitation, pressure, cloud cover, waves and more, and scrub a timeline forward to watch systems develop. It was built by the Czech company InMeteo and runs in any modern browser.
Is Ventusky free?
The web map is free to use with no account required, and there are free mobile apps as well. A paid tier exists that unlocks extra features such as additional forecast models and an ad-free experience, but the core map and forecast layers are available to everyone.
Which weather models does Ventusky use?
It draws on several numerical weather prediction models, including global ones and higher-resolution regional models covering particular parts of the world. You can switch models from the settings, which is useful because comparing two forecasts for the same place tells you how confident the prediction actually is.
What is the difference between Ventusky and Windy?
They cover similar ground and both animate global forecast data over a map. Ventusky tends to be the cleaner and more legible of the two, with a strong emphasis on the visual rendering of each layer, while Windy leans toward density and offers more specialist tools and overlays. Most people who care about weather maps end up keeping both.