// 2026-08-14 · Data & Research · by Bob Smith
Google Books Ngram Viewer: Five Centuries of Print as a Single Line Graph
Type a word, get its frequency in printed books from 1500 to 2022. The Ngram Viewer has wildcards, part-of-speech tags and downloadable raw data — plus caveats worth knowing before you quote it.
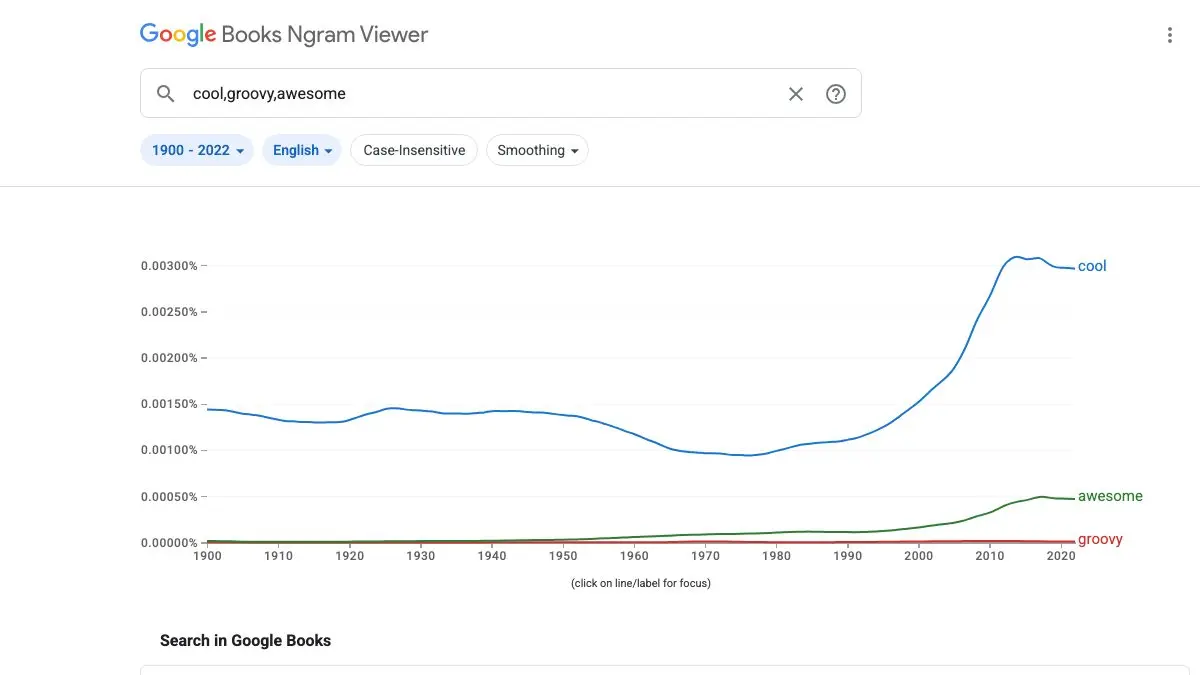
Google Books Ngram Viewer does one thing, and it does it in about a second. Type a word. Get a line showing how common that word was in printed books, year by year, going back centuries.
It is one of the few genuinely serious research instruments that is also an excellent way to lose forty minutes. Plot telegram against telephone against email and you watch three communication technologies hand off to each other. Plot gramophone and you can date the arrival of a word almost to the year. Plot your own surname and see what happens.
The catch is that the line is easier to read than it is to interpret, and the tool gives you far more control than the single search box suggests.
What is the Ngram Viewer?
An n-gram is just a sequence of n words. Google scanned millions of books, chopped the text into sequences of one to five words, counted how often each sequence appeared in each publication year, and normalised those counts against how much was published that year. The Ngram Viewer is the front end to that count.
It went live on 16 December 2010. Google’s Will Brockman and Jon Orwant built it with Jean-Baptiste Michel and Erez Lieberman Aiden at Harvard, and it shipped the same day as their Science paper, “Quantitative Analysis of Culture Using Millions of Digitized Books”, which argued that a corpus this size lets you measure cultural change quantitatively. They called the approach culturomics. At launch the corpus held roughly 500 billion words from 5.2 million books.
It has grown since. The viewer now covers printed sources from 1500 to 2022, in English, Chinese (simplified), French, German, Hebrew, Italian, Russian and Spanish, with separate American English, British English and English Fiction corpora for when the distinction matters. Only n-grams appearing in 40 or more books are indexed, which keeps the noise down and means a flat line at zero often signals “too rare to count” rather than “never written”.
What can you do with the Ngram Viewer?
- Compare terms head to head. Comma-separate several queries and they plot on the same axes. This is the whole tool in one gesture, and it is where most of the value is.
- Use a wildcard.
University of *returns the ten most common words that followed that phrase. One*per n-gram, but it turns the viewer from a lookup into a discovery tool. - Catch every inflection. Append
_INF—book_INF a hotelsums book, booked, books and booking into one line rather than making you chart four. - Filter by part of speech. Tags like
_NOUN_,_VERB_,_ADJ_,_ADV_,_PRON_,_DET_,_ADP_,_NUM_,_CONJ_,_PRT_and_PROPN_disambiguate a word from its homographs._START_,_END_and_ROOT_work standalone for sentence-position queries. - Query grammatical relationships. The
=>operator finds one word modifying another regardless of the distance between them, sodessert=>tastycatches the pairing wherever it sits in the sentence. - Do arithmetic on lines.
+sums expressions,-subtracts,/divides one by another and*multiplies by a constant. Dividing one term by a related one is the cleanest way to strip out the background growth of print. - Compare across corpora. The
:operator applies an n-gram to a different corpus, so you can put the British and American lines for the same word on one chart. - Fold case together. A checkbox sums the common case variants, which matters more than you would think for anything that is sometimes a proper noun.
- Control smoothing. Smoothing of 1 averages each year with one year either side; 0 gives you the raw, spiky counts.
- Download the lot. The full datasets are published as tab-separated files under CC BY 3.0, with occurrence counts and book counts per year.
Tips to get the most out of it
- Start at 1800, not 1500. Google only claims reliability from 1800 onwards. The 16th and 17th century end of the range is thin enough that a single scanned book can throw a visible spike.
- Remember the long s. Pre-1800 printing used ſ, which scanners read as f. Before you conclude a word was unfashionable in 1750, search the f-spelling too —
beftforbestis the classic demonstration. - Set smoothing to 0 when a spike matters. The default smoothing quietly turns a one-year event into a gentle three-year hill. If you are dating an arrival, look at the raw counts.
- Divide rather than eyeball. Absolute frequencies drift because the corpus composition drifts — scientific publishing in particular is over-represented and grows over time. Plotting
x / (x + y)answers “which of these two won” without that drift baked in. - Click through to the books. Below the chart are date-range links that run the actual Google Books search for your term in that period. This is the single best habit to build: it is how you find out that your 1920s spike is one mis-dated reprint.
- Treat one book as one book, cautiously. The chart is built from occurrence counts, so a single work using a term two hundred times moves the line as much as two hundred books using it once. The downloadable files carry a separate volume_count precisely because the distinction matters.
- Take the URL, not the screenshot. Every chart’s full state lives in its query string, so a link is a reproducible citation. Note which corpus version you used — charts genuinely change between releases as OCR improves.
If you like the Ngram Viewer, also try…
- Our World in Data: the same instinct — long time series, plotted honestly — applied to everything from life expectancy to energy.
- The Pudding: visual essays that do the interpretive work an Ngram chart leaves to you, often on language and culture.
- WorldCat: when you need to know what a book actually is, who published it and where a copy sits, rather than how often a phrase appeared in it.
- OneLook Reverse Dictionary: for the other half of a word question — finding the term you are groping for before you go and chart it.
Browse more things worth bookmarking in our Data & Research collection.
Frequently asked questions
What is the Google Books Ngram Viewer?
It is a free chart tool that plots how often a word or phrase appeared in printed books over time. Google scanned millions of books, counted every sequence of one to five words in them, tagged each count with the book's publication year, and put a search box in front of the result. You type a term and get a line running from 1500 to 2022 showing its relative frequency in print. It launched on 16 December 2010, built by Google's Will Brockman and Jon Orwant with the Harvard researchers Jean-Baptiste Michel and Erez Lieberman Aiden, alongside a Science paper called 'Quantitative Analysis of Culture Using Millions of Digitized Books' that coined the term culturomics for this kind of work.
Which languages and date ranges does it cover?
The viewer charts printed sources published between 1500 and 2022. The corpora are English, Chinese (simplified), French, German, Hebrew, Italian, Russian and Spanish, plus three specialised English sets: American English, British English and English Fiction. The default view starts at 1800 rather than 1500 for good reason — Google itself only claims the results are reliable from 1800 onwards, because before that the corpus is thin and the scanning is less accurate. Some languages are patchier still; the Chinese data is generally treated as usable only from much later. Older versions of the corpus, generated in 2009, 2012 and 2019, are no longer in the dropdown but can still be reached through search operators.
How accurate is the data, really?
Accurate enough to spot a big trend, not accurate enough to settle an argument on its own. Three problems recur. First, optical character recognition errors: in books printed before about 1800 the long s (ſ) is routinely read as an f, so 'best' becomes 'beft' and the real word appears to vanish from the record. Second, corpus composition — the set of scanned books is not a representative sample of what people read, and scientific literature is over-represented, which mechanically pushes down the share of everything else. Third, metadata: some books are dated or categorised wrongly, and the viewer exposes no author, genre or length information you could use to filter them out. Google's own OCR has improved measurably across corpus versions, so a chart drawn today may not match one drawn in 2012.
Can I download the underlying data?
Yes, and this is the part most people miss. The full n-gram counts are published as compressed tab-separated files under a Creative Commons Attribution 3.0 licence, so you can analyse them yourself without the chart in the way. Version 3 was generated in February 2020, with earlier versions from July 2012 and July 2009 still hosted. Each line gives the n-gram, the year, a match_count (how many times it occurred) and a volume_count (how many distinct books it occurred in). Note that only n-grams appearing in at least 40 books make it into the index at all, so genuinely rare terms are absent rather than flat.
Visit Google Books Ngram Viewer →
← All posts · Browse the directory